
| Encircled Flux For Multimode Fiber Measurements The material here is not necessarily what you will read from standards committees or manufacturers, but an independent review that tries to be unbiased. It builds on the FOA reference guide page on modal distribution. What Is Encircled Flux? Encircled flux is being adopted as a purportedly more precise method of defining mode fill for bandwidth simulation and loss testing. Encircled flux (EF), defines the integral of power output of the fiber over the radius of the fiber. It sets limits for the amount of optical power included within a specified radius of the fiber core. When you look look at the graph below, consider that the vertical axis is the total amount of optical power from the source coupled into a fiber core inside the radius shown in the horizontal axis. An underfilled fiber has more power within a given radius so it becomes the upper curve (blue) below. An overfilled fiber will have less power nearer the core and more power in the outer regions of the core, so it becomes the lower curve (green/yellow). EF was defined during the development of 10 GB Ethernet as a way to define the light output from an ideal VCSEL source which concentrates more of its power in the center of the fiber than a LED. The EF definition was only used for bandwidth simulation by the Ethernet committee. Of course a real VCSEL may be (is likely to be) different, but this model allowed calculating the bandwidth of this ideal VCSEL in various types of fibers of various lengths to determine their capability of supporting 10 GBE. It was later decided that EF would be a better way to define mode fill for loss testing, replacing previous methods in use since the mid-1980s. EF has become part of several new MM testing standards. It is intended to create a more reproducible modal condition for testing that is similar to the CPR/mandrel wrap method described below. Since EF is new, testing sources for EF is not easily available nore has it been demonstrated to be well correllated between labs or manufacturers, so using it is not yet widely accepted. It will probably not be a widely used method before 2012. 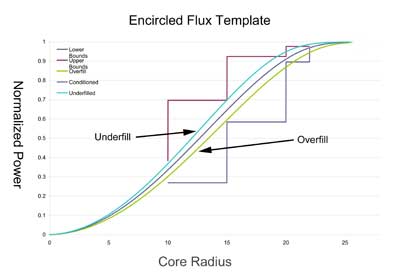 EF Graph: The vertical (Y) scale shows the total power from the core of the fiber up to a point on the radius (in microns), so when one gets to 25 microns, one measures all the power. The shape of the curve is chosen to emulate an idealized source that is between underfill and overfill conditions. This method of measuring mode fill should be more precise than other methods like CPR. EF should be easier to measure using imaging devices that can be calibrated. But first it needs to be developed into a practical application.  Here you can see part of the measurement problem. The difference between overfill/underfil and the EF target is not very big, making it more difficult to either measure or control.
From Bandwidth to Loss to Making An OTDR and OLTS Agree (?)
Is Mode Power Distribution The Biggest Issue In MM Testing? From all the discussions on EF and its affect on the precision of MM testing, you would think it was the only factor to consider in making MM loss measurements. Well, it isn't. Besides mode fill, these other factors are important in the uncertainty of MM loss measurements: Instrument-Induced Errors
Process Induced Errors
Many of these factors are not ignorable. Look at the source wavelength, for example. In the graph below, you can see the variation of attenuation of OM4 fiber over the range allowed for source variation at 850 nm - it's 0.6 dB/km. Worst case error for source wavelength on a 100m link is 0.06 dB. Variations in fiber and connector geometry can add even greater variability. (read more) Of course, it makes sense to control all variables as carefully as possible, but it's important not to focus on one and forget the others! 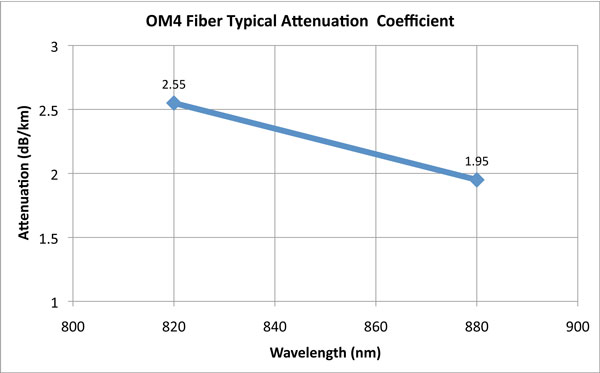 You can test your own sources and meters for stability by connecting a source to a meter with a cable and turning them on without warmup and see how much the reading of the meter varies. Likewise you can (after they warm up) wiggle the cables around, especially around the instrument connectors, to see how much variation you can induce. The quality of the lauch cables can be tested by mating them to each other under controlled conditions. I'm surprised that more attention has not been given to the standards because they allow 3 different methods of "0 dB" reference and OTDR testing. For results from our own tests using different test methods, see this FOA reference page Creating EF Conditions For Testing Setting up a source and launch cable for EF requires some care. Few techs think they are capable of creating their own mode control launch setup, so some have been tempted to purchase a "black box" that is specified to produce EF at a high cost. We believe that all companies selling such a product are now getting them from a single supplier. That supplier has received a patent on their product which includes the drawing below. It uses a mode scrambler followed by a gap-type mode filter (the gap loss is in the higher order modes). This technique has been known since the mid-1980s and was probably first patented at that time by somebody like AT&T. It's very complicated, unidirectional (not good for OTDRs), and must be reterminated regularly because of connector wear and tear. 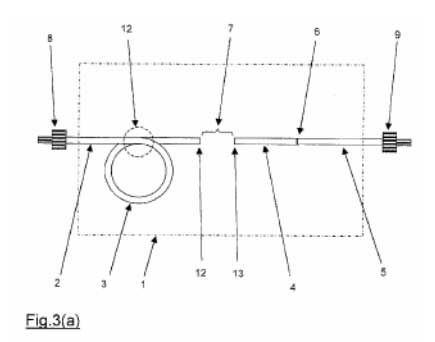 Another option developed for FDDI around 1990 by Fotec was a special mode-scrambling step-index multimode fiber of limited numerical aperture that created similar mode conditions with any source but very cheaply. The FOA is investigating using this method since the Fotec patent expired in 2003.
What Do Manufacturers Say? Here is a slide from a recent Corning presentation: 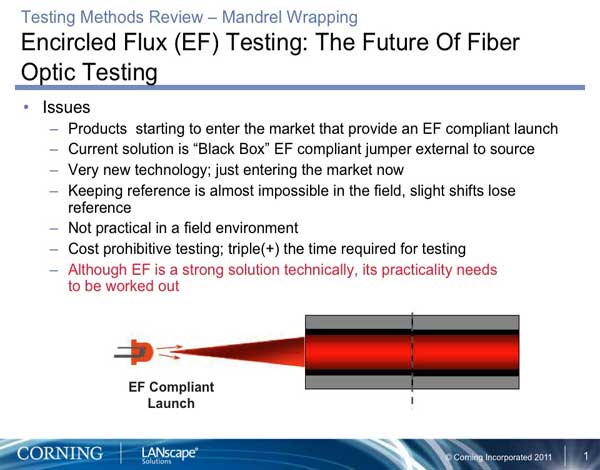 At the TIA meeting in Philadelphia in October 2013, the TR-42.11 committee responsible for OFSTP-14 agreed to modify the document to require EF only for that case and at 850nm only, not for any other multimode fiber type nor at 1300nm. Data was presented by Fluke that showed that mandrel wrap conditioning would bring most sources into EF compliance. The committee is working toward a solution that calls for a mandrel wrap tested by HOML - higher order mode loss. HOML measures the power before and after the mandrel wrap and looks for a specified power loss due to the mandrel wrap. The slide below, presented at the TIA meeting, shows how a fiber with overfilled condition becomes EF compliant with a simple mandrel wrap. More work is continuing to validate this approach and include it in the TIA OFSTP-14 standard. 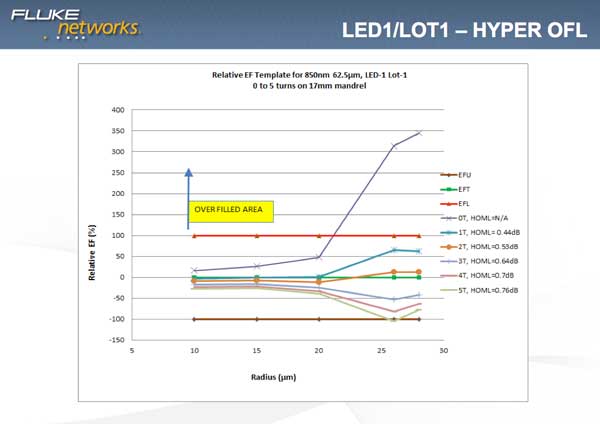 Bend-Insensitive Fibers Bend-insensitive fibers (both MM and SM) have become popular for use as patchcords and running cables inside buildings where tight bends may be needed. BI fiber uses changes in the index profile to reflect leaky modes back into the fibers. BI MM fibers may have more higher order modes and thus more mode fill. They also do not respond to mandrel wrap mode filtering in the same way, generally requiring much tigher bends to achieve the same effect. When using BI MM fibers for launch cables that need modal conditioning, contact the fiber manufacturer for their recommendations. Mode Control By Mandrel Wrap 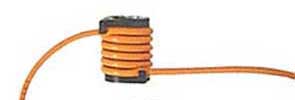 Mode filters are used to selectively remove higher order modes to attempt to simulate EMD conditions, assuming that one starts with fully filled modes. Higher order modes are easily removed by stressing the fiber in a controlled manner, since the higher order modes are more susceptible to bending losses. The most popular mode filter is the "mandrel wrap", where the fiber is snugly wrapped around a mandrel several times. The size of the mandrel and the number of turns will determine the effect on the higher order modes. Other mode filters can be made where the fiber is subjected to a series of gentle S bends, either in a form or by wrapping around pins in a plate or by actually using a long length of fiber attached to an overfilling source. Below is the mandrel wrap specification from TIA 568, which is to be used with what is basically an overfilled (Category 1 CPR) LED source.
NOTE The mandrel diameters are based on nominal values of 20 mm (0.79 in) and 25 mm (0.98 in)) reduced by the cable diameter and rounded up. Following this method using conventional fibers will result in a mode fill similar to EF, the new requirement for MM testing standards. Checking Mandrel Wrap with HOML - Higher Order Mode Loss 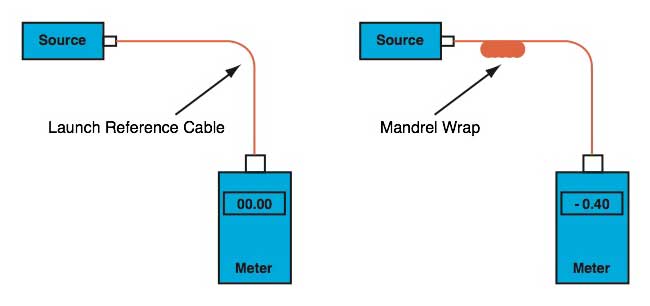 HOML is simple to use. Connect the launch reference cable to a source and measure the output of the reference cable with a power meter. Wrap the launch reference cable around the specified mandrel and measure the output again. If the measured power is reduced by 0.2 to 0.6 dB, the source is essentially EF compliant and ready to use, without the mandrel. Remove the mandrel and make your tests. If the HOML is >0.6dB, leave the mandrel on the reference launch cable and make measurements. If the HOML is <0.2dB, the source has too low a mode fill and should not be used. Following this method using conventional fibers will result in a mode fill similar to EF, the new requirement for MM testing standards. More on HOML is at the bottom of this page on mode power. Return to the FOA Online Reference Guide Table of Contents |
||||||||||||||||||||
|
|