
Topic: Metrology And Fiber Optics |
Table of Contents:
|
Metrology - The Science Of Measurements One issue affects everyone who is designing, installing or using fiber optics – measurements. We depend on them to find our how well things work, especially verifying the quality of installed fiber optic cable plants. The one common type of question we receive concerns measurement "accuracy," but only rarely does the questioner really understand what "accuracy" means. To provide an answer, we need to explain to the questioner what a “measurement” is and then what accuracy is. That is the first subject of this technical paper. By the way, the scientists at NIST (National Institute of Standards and Technology, formerly the US National Bureau of Standards) used to correct anyone using the term "accuracy," saying the correct term was "measurment uncertainty." What Is Measurement? To understand accuracy, one must first understand "measurement." To measure something means to observe its characteristics and compare it to some standard "unit" of measurement. For example, if we measure length with a ruler, we compare the length of the unknown item to the standard lengths marked on the ruler and express the length in the units that the ruler is calibrated to – mm, cm, inches, etc. Likewise we measure time with a stopwatch calibrated in seconds, minutes, hours, etc. Weight is measured with a scale calibrated in grams, kg, ounces, pounds, etc. In fiber optics, we measure length with an OTDR, optical power with a power meter, insertion loss with a light source and power meter (LSPM or OLTS), loss with an OTDR, etc. We have units to measure each in and instruments to measure them calibrated in units we understand. What Is Accuracy? Precison? Accuracy: The degree to which the results of measurement conforms to the actual value or a standard. Precision: Refinement in a measurement shown by repeated measurements producing nearly the same result. Metrologists (the name for those who study or practice the science of measurements) talk about two different terms that we often think of as accuracy. There is “accuracy” that refers to the closeness of the measured value to the actual value and “precision” which refers to the variations you get when making measurements. One needs to understand each well to understand measurements. If we measure something, accuracy is our goal; we want to know what is the actual value of the thing we are measuring. But when we make the measurement, there are uncertainties in the measurement and those uncertainties contribute to the variation in measurements we make which affect the precision of the measurement. 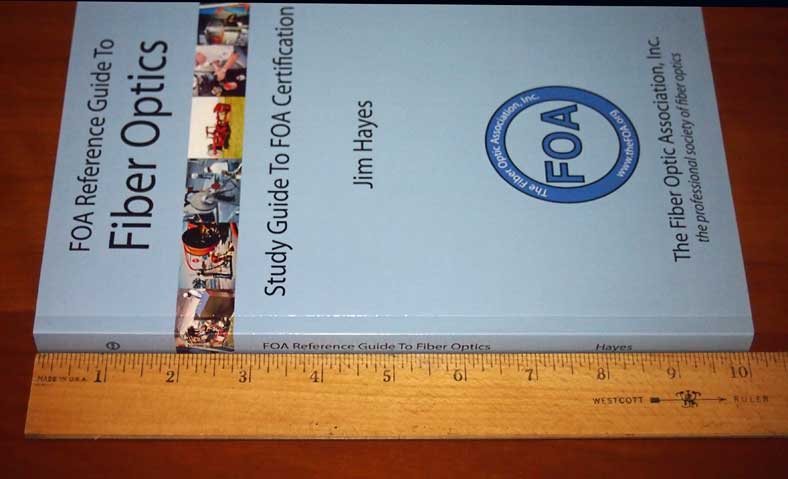 Measuring a book with a ruler Let's go back to our length measurement with a ruler. The measurement we make is going to vary according to how we place the ruler next to what we are trying to measure and how we move our head as we look at the point where the ruler measures the length. Each time we make the measurement, the reading we get can be slightly different, affecting the precision. Precision is affected by two factors, random errors and systematic errors. Random errors would be the variation each time we read the ruler affected by where our eye is positioned with respect to the ruler and the thing we are measuring. Systematic errors could be caused by the positioning of the ruler at the other end of the thing we are measuring, so every measure has an offset is the two ends are not perfectly aligned. 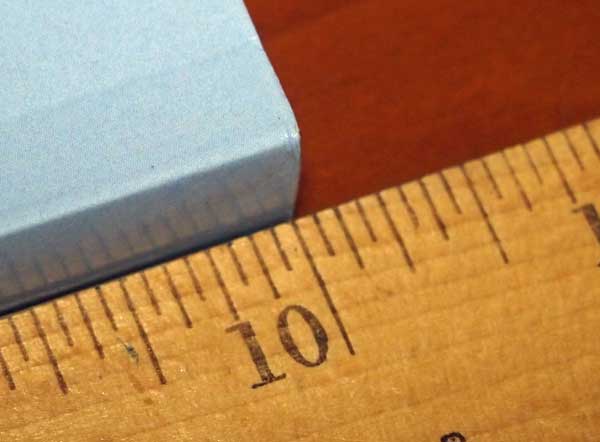 The measurement depends on the angle of view, here we might measure too long. The measurement depends on the angle of view, here we might measure too long.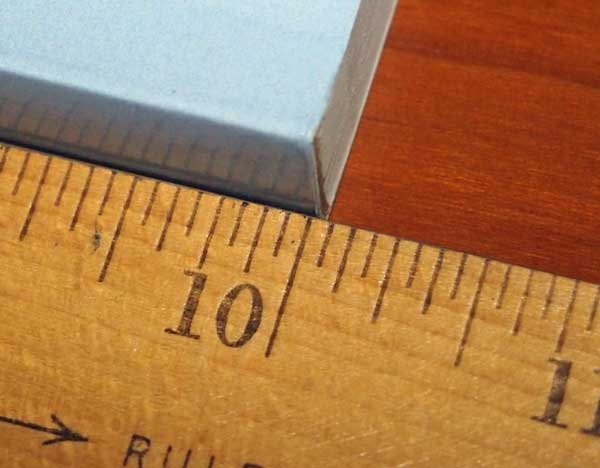 And here we might measure too short. And here we might measure too short.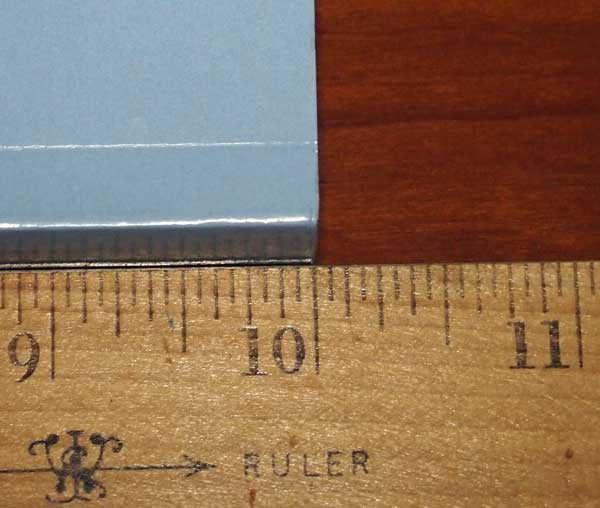 But we get a more accurate measurement if our view is aligned with the end of the book. But we get a more accurate measurement if our view is aligned with the end of the book.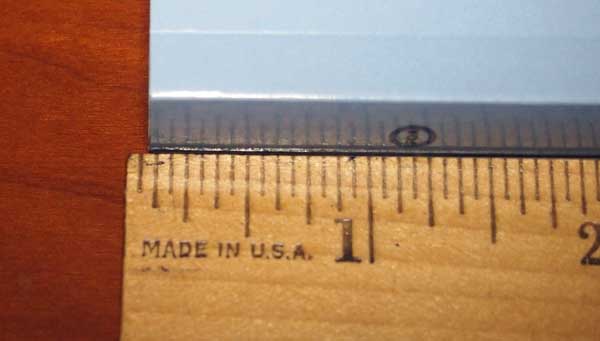 If the other end of the ruler is offset from the end of the book, all measurements will be systematically offset from the actual length. If the other end of the ruler is offset from the end of the book, all measurements will be systematically offset from the actual length.Back to accuracy. The accuracy of the measurement will also depend on the calibration of the measurement tool. If our ruler is not perfectly calibrated, it will cause systematic errors. If the markings on the ruler are hard to read, it can cause random errors. The combination of all the errors means that the length we measure is not exactly what the length we are measuring really is. The difference is the inaccuracy of the measurement. What Does That Mean In Fiber Optics? Insertion Loss Measurements Let's examine a common fiber optic measurement, insertion loss of a fiber optic cable plant. 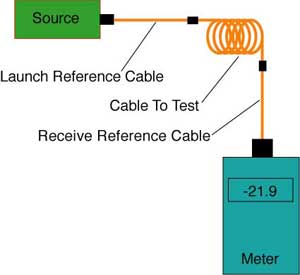 To make this measurement, we need a light source – let's make it multimode so it's a 850nm LED – a power meter and two reference test cables to use as a launch cable and a receive cable. We will assume all the connectors on cables and test equipment are the same, say SC. We set the "0dB" reference by attaching the launch reference cable to the source and meter (this being a one cable reference, we will talk about 2 and 3 able reference methods later) turn on the source and let it warm up. Once the source is stable, we measure the power at the power meter which is set on the 850nm wavelength and dB range for loss. When we are ready, we push the button on the meter and get a "0dB" reference reading and a display of 0dB on the meter. Next we disconnect the meter from the launch cable (but always keep the launch cable attached to the source – removing it and reattaching it loses the 0dB reference and causes another potential error. We attach a receive cable to the meter and then connect our cable plant to test between the connector on the launch cable and the connector on the receive cable using mating adapters. (see drawing above) Now we are launching power from the source/launch cable into the cable plant where it is attenuated by the components in the cable plant – first the connection to the cable plant at the launch cable, the loss of the fiber in the cable plant under test and any connections or splices in it, then finally the loss of the final connection at the receive cable. Our meter reads a loss, say it reads -3.09dB, because the power from the source/launch cable has been attenuated by the components in the cable plant we are testing. Simple enough, right? But the real question is what is the actual loss of the cable plant? What is the accuracy of our measurement? I don't mean to disappoint you, but the answer to those questions is "we can never know!" The best we can do is estimate the accuracy of the measurement, so let's do that. Let's try to analyze all the sources of error and estimate their uncertainty. To simplify it, let's create a table listing the sources of error and explain them. Most of them you have heard discussed, some more than others, so they will probably be familiar to you. Insertion Loss Errors
What About Loss With An OTDR? That's another question we get often at FOA. There are several aspects of the question. How accurate are OTDR measurements? How do they compare to insertion loss tests? How do different OTDRs compare? Unlike the light source and power meter that measures loss in the same manner as a transmission system works, the OTDR uses a indirect method of measurement based on backscattered light. It also needs longer launch and receive cables than the light source and power meter use for reference cables since it needs more length because of its limited resolution. While all the variables noted above affect OTDR measurements in the same manner as insertion loss measurements, the OTDR also has a few unique sources of error. Best known is the difference in backscatter of two fibers at a connector or splice that cause the OTDR to measure a loss that is too high (going from high backscatter to low) or too low, even a gain (going from low backscatter to high.) This error is reduced by measuring in both directions and averaging. Another major error in OTDR measurements is caused by the placement of the markers that determine where on the trace the measurements are made, even if you use the "least squares" mode to reduce the variations. This creates a random error that affects the precision of the measurement. If you use an "auto test" function, the placement of the markers is done by software and the reproducibility will be a function of the software algorithms. Which brings up a big issue for OTDRs, software. Software is very much a part of OTDR measurements. It controls the setup parameters, controls the test pulse and averages the return backscatter and reflectance signals to create the trace. If you use use auto test, software decides where to place markers and make measurements. Software, therefore, plays a big role in the precision of OTDR measurements. The role that software plays in the measurement is hard to evaluate. You could test the same cable plant with two different OTDRs using different software and compare the results, but many of the variables noted above also contribute to the variability of the measurements. While it is hard to evaluate the actual precision and accuracy of OTDR measurements, our experience is that the precision and accuracy are lower than the simpler insertion loss tests. OTDR Measurement Errors
Of course if one added up all the possible uncertainties, it would be several dB and measurements would be practically impossible. However, all setups are not worst case and even so, some variables are going to be positive and some negative, so they tend to cancel each other out. The Statistics of Measurements Metrologists look at the statistics of measurements. They set up experiments that minimize the variability of factors that can affect the measurement, make many measurements and do a statistical average of the measurements and calculate the variation, usually stated as the "standard deviation" for which they use the Greek letter sigma (σ). The standard deviation is an expression of the precision of the measurement, not the accuracy. (See below for more explanation of the math involved.) The accuracy of the measurement is hard to define because you must define a standard to compare your measurement to – like a ruler for length or a scale for weight. But what do you use for a comparison when you make a loss measurement? One could have a cable plant that was carefully constructed and tested by a standards lab using a source of carefully chosen wavelength and mode fill, a meter with extremely good linearity, reference cables chosen to have near perfect fiber geometry (core diameter, ovality, NA, etc.) and terminated carefully to have low loss (~0.1dB or less when tested against each other) and using a lab setup that put no stress on the fibers. One could then test that cable plant under those careful conditions, get loss values with many measurements so the standard deviation is known and create a "transfer standard." Then the "standard cable plant" could be sent to other labs which would test it under their conditions and get similar data. This is called a "round robin" test and is often done to understand measurement accuracy. It's done "blind" – that is no lab knows what is the "right answer" so there is no bias in their results. Then the standards lab gathers all the data and analyzes it, looking for two things: how did the lab's results compare to the "standard test value" of the ample cable plant and how much was the standard deviation of the lab's measurements. Now we can start talking about accuracy and precision again. If we assume the standards lab result is the actual measurement because it was made under tightly controlled conditions, the variation of the measurement by each of the other labs is their inaccuracy. And if we average statistically all their variations, it becomes a measure of the precision of the measurements made by labs. What if we gave that same standard cable plant to a group of random fiber optic installers and asked them to measure it? Then we would have a sample of the real world and the variations could be analyzed as an example of the accuracy and precision of measurements in the real world. Setting A Standard For Measurements We're still not ready to talk about accuracy. To do so, we must have an acceptable "standard" to compare measurements to. For a test like cable plant loss, with so many variables that can cause measurement differences, we are best to tightly specify the variables in the test conditions. In many physical measurements, it's referred to as "STP" – standard temperature and pressure (atmospheric pressure) that was adequate for many physical measurements. Even standards have some variance – they are not perfect. Standards organizations like the US NIST (National Institute of Standards and Technology) are continually trying to make more precise standards. Length standards, for example, have gone from things like the length of a king's foot to metal bars in controlled conditions to the wavelength of light from a special source. For our loss testing, it is hard to create a standard that everyone can measure against since a cable plant to send around for comparison would wear out and the loss would get higher as the connectors on the end wore out. Instead we specify the test conditions which includes the source, meter and reference test cables characteristics. In fact, many if not most standards for fiber optic testing cover all these variables but, in recognition of the realities of component variations, that still leaves the substantial variability that we have documented in the table above. In other words, perfection is unobtainable. We have to learn to live with it. In The Real World Sometimes exactly the process described, where a standards lab initiates a program to establish a standard, happens to a new technology. This process was done in the mid-1980s for measuring fiber optic power after it was discovered that power meters from different companies measured the same source but got results almost 3dB apart! But measuring power is much simpler than measuring loss since the variables are much smaller and easier to control. All that was necessary was to create a program that calibrated a fiber optic power meter (a highly stable lab model) to the NIST primary standard for optical power, then send that meter around to manufacturers to calibrate their working standards (the one they used to calibrate their power meters) for use in manufacturing. This brought the uncertainty of power measurements down from 50% to <5%, a major accomplishment. Such a program was once proposed to create a calibration for loss, but the program never got off the ground for lack of agreement on what would constitute a "standard" cable plant for loss measurements. That is unfortunate, since having many instruments measure the same cable plant could provide lots of useful data on the precision of OTDR measurements, it not the accuracy. As a result, fiber optic loss measurements in the real world are limited in their "accuracy" and precision. Thankfully, the systems that are the most critical like the <2dB cable plants for MM fiber at 850nm for 10G transmission will have the lowest variability because of the shorter lengths of fiber, fewer connectors and lower loss. And most long, high loss links will have more margin. The Math Of Averages The average of a number of measurements is calculated by summing the value of all the measurements and dividing by the number of measurements. If we make “n” measurements and get results “m1 + m2 + m3 .....mn” Average (M) = (m1 + m2 + m3 .....+mn) / n The “ standard deviation” is a measure of how all these measurements vary. It is calculated by taking the difference between the mean and each measurement, squaring it (multiply by itself), adding all those together, dividing by the number of measurements, then taking the square root of that. Standard deviation (σ) = √{ [ (m1 –M)2 + (m2 –M)2 + (m3 –M)2 .....+(mn –M)2 ] / n } Standard deviation (σ) is widely used because it helps understand a standard distribution (Gaussian) of measurements. Approximately 68% of the values lie within one standard deviation of the mean, 95% of the values lie within two standard deviations of the mean and nearly all (99.73%) of the values lie within three standard deviations of the mean. 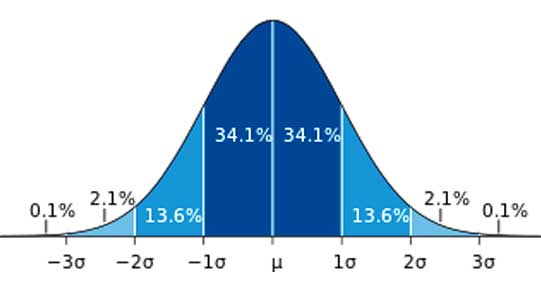 |
|
Return to the FOA Online Fiber Optic Reference Guide Table of Contents |